Research Article | | Peer-Reviewed

Reliability Analysis and Performance Assessment of the Badiari Hybrid Photovoltaic Power System (Sedhiou, Senegal)

Received: 5 December 2025     Accepted: 18 December 2025     Published: 16 January 2026
Views:       Downloads:
Abstract

In the context of the energy transition and Senegal’s objective to increase the share of renewable energy to 20%, this study investigates the reliability of an off-grid photovoltaic (PV) power plant located in the village of Badiari, Sédhiou region, in the south of the country. Over a three-month period (June to August), corresponding to the rainy season, the 5 kWp production system was continuously monitored using an intelligent SMA inverter, enabling minute-by-minute data collection. The analysis reveals a clear mismatch between the system’s generation capacity and the users’ energy demand. The lead-acid batteries (1,000 Ah) undergo recurrent deep discharges, occasionally reaching critical levels (21 % state of charge), significantly shortening their operational lifespan. Simultaneously, the backup generator, intended to mitigate these deep discharges, is seldom activated. Frequent overvoltage events, shutdowns due to extreme temperatures (up to 80 °C at the heat sink), and islanding phenomena highlight both system imbalance and structural vulnerability. Reliability metrics were quantified, with a Mean Time Between Failures (MTBF) of 10,907 minutes and a Mean Time To Repair (MTTR) of 43 minutes in June, compared to 8,671 minutes and 329 minutes, respectively, in August. These values underscore the irregularity of energy supply. The findings emphasize the need to reconsider the sizing and maintenance strategies of rural solar installations. Recommended measures include increasing battery bank capacity (up to 2,500 Ah), introducing power limiters for consumers, and improving the thermal management of the technical room (ventilation, insulation). Implementing these strategies is expected to enhance local energy autonomy and improve the long-term sustainability of solar infrastructures.

Published in International Journal of Sustainable and Green Energy (Volume 15, Issue 1)
DOI 10.11648/j.ijsge.20261501.11
Page(s) 1-13
Creative Commons

This is an Open Access article, distributed under the terms of the Creative Commons Attribution 4.0 International License (http://creativecommons.org/licenses/by/4.0/), which permits unrestricted use, distribution and reproduction in any medium or format, provided the original work is properly cited.

Copyright

Copyright © The Author(s), 2026. Published by Science Publishing Group

Keywords

Solar Energy, Off-grid Photovoltaic, Maintenance, Reliability, Batteries, Energy Transition, Energy Autonomy

1. Introduction
The Just Energy Transition Partnership (JETP), established in June 2023 with international partners, provides €2.5 billion in funding to support Senegal's energy transition. The objectives include increasing the share of renewable energy to 40% of the electricity mix by 2030 and developing a national green industry . Most of the efforts are focused on solar energy. Experience shows that a number of power plants that have already been built are no longer operational, as evidenced by the hundreds of solar streetlights lying unused in the streets of the capital . As there is no shortage of sunshine, the obsolescence of the installations is mainly due to a lack of monitoring and maintenance. This study is part of research work focused on the maintenance of solar photovoltaic installations in Senegal, which has already led to the implementation of a Computerized Maintenance Management System (CMMS), the design and implementation of which have been completed..
This research aligns with Senegal’s ongoing policies under the Green Plan for an Emerging Senegal and the National Strategy for Sustainable Energy Access (SNASE, 2021), both of which promote renewable integration and the digitalization of maintenance practices. It also supports the objectives of the Just Energy Transition Partnership (JETP, 2023), which aims to achieve 40% renewable electricity generation by 2030 through resilient, data-driven energy systems. The Badiari case study thus provides operational insights to guide the implementation of these national and international frameworks, based on minute-by-minute monitoring using a device including an SMA-type inverter . After processing the data, we first propose an analysis of consumption, which will lead to an assessment of the system's adequacy in relation to consumption. Secondly, the events that occurred during this period, namely breakdowns, warnings, and operating statuses, are processed in order to calculate reliability times, namely MTBF (Mean Time Between Failures) and MTTR (Mean Time To Repair). Finally, recommendations are made to prevent these events .
2. Materials and Methods
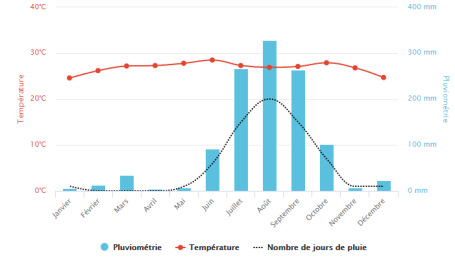
Figure 1. Temperature and Rainfall in Badiari.
The power plant is located in the village of Badiari in the Sedhiou region, one of Senegal's 14 administrative regions. It is located in the center of Casamance, or Middle Casamance.
Badiari has a “savanna with dry winter” climate according to the Köppen-Geiger classification. Rainfall in Badiari is much higher in summer than in winter. Over the year, the average temperature in Badiari is 81.6°F (26.9°C) and rainfall averages 45.5 inches (1147.5 mm). By comparison, in Dakar, the average annual temperature is 75.6°F (24.3°C) and rainfall averages 21.1 inches (537.7 mm) .
Technical specifications:
- Photovoltaic generator: 5 kWp (24 monocrystalline
modules of 215 Wp, 3 rows)
- Generator: 15 kVA (single-phase)
- SMA inverter: 5 kW (peak power up to 12 kW)
- Batteries (lead-acid): 1000 Ah (wired to 48 V)
- Installation date: May 2012
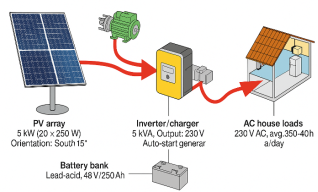
Figure 2. Composition De La Centrale.
Following the analysis of Failure Modes, Effects, and Criticality (FMEC) already carried out and published, this study will discuss the performance of a 5 kWp solar power plant installed in the south of the country, more specifically in the Sedhiou region. Over a period of three months, the plant's operation was monitored minute by minute.
1) During June, July, and August, measures were taken and the following parameters were selected:
2) BatSOC (Battery State of Charge), which provides information on the charge level of the batteries.
3) SOC (State of Charge) refers to the current available battery capacity in relation to the maximum capacity.
4) InvPwrAt (Inverter Active Power) refers to the active power delivered by the inverter.
5) ExtPwrAt (External Generator Active Power) refers to the active power supplied by the backup generator.
6) BatSOH (Battery State of Health): provides information on the health of the batteries.
7) SOH (State Of Health) refers to the maximum available battery capacity compared to the nominal capacity Cn. Over time, the available capacity may temporarily or permanently .
a) Reliability Analysis Methodology
Reliability analysis in this study is based on operational event logs recorded by the SMA inverter with a one-minute time resolution . All recorded events were classified according to their operational impact into failures and warnings, following the manufacturer’s diagnostic documentation.
A failure (Fxxx code) is defined as any event leading to a complete inverter shutdown, resulting in an interruption of power supply and requiring either manual or automatic restart before normal operation can resume. Only such events were considered in the calculation of reliability indicators. In contrast, warnings (Wxxx codes) correspond to non-blocking events that allow the system to continue operating and were therefore excluded from MTBF and MTTR calculations.
Partial shutdowns, transient alerts, and repeated notifications associated with the same root failure were not counted as independent failure events. Automatic restart attempts following a shutdown were treated as part of the same failure episode.
Prior to reliability computation, raw event logs were preprocessed to remove duplicated records and consolidate consecutive alerts linked to a single failure. Downtime was defined as the elapsed time between the recorded shutdown timestamp and the effective system restart.
The reliability indicators were computed using standard formulations as follows:
MTBF = T_operation / N_failures
MTTR = ΣT_downtime / N_failures
where T_operation represents the total system availability time over the observation period, N_failures is the number of recorded shutdown events, and T_downtime corresponds to the duration of each failure-related outage.
b) Scope and Limitations of the Study
This study is based on a single off-grid hybrid photovoltaic installation with a nominal capacity of 5 kWp located in Badiari, southern Senegal. As such, the results primarily reflect site-specific operational conditions, including local consumption patterns, climatic stressors, and the use of lead-acid battery storage.
While the findings provide valuable insights into the reliability and maintenance challenges of rural mini-grids operating under humid tropical conditions, they should not be considered universally representative. In particular, caution is required when extrapolating these results to systems using lithium-ion batteries, alternative inverter architectures, or operating in markedly different climatic zones such as arid or semi-arid regions.
Nevertheless, the observed failure modes, battery degradation trends, and generator utilization inefficiencies are consistent with challenges reported in similar rural electrification projects across Sub-Saharan Africa. Future work will aim to extend this analysis using larger datasets from multiple sites and technologies to improve generalizability and enable comparative assessments.
3. Performance and Operational Analysis of the Power Plant
The present section provides a detailed assessment of the plant’s operational behavior by examining energy consumption patterns and the sequence of operational events recorded during the period under study. This analysis makes it possible to identify trends, anomalies, and potential sources of inefficiency that may influence overall system performance. Particular attention is given to the month of June, during which consumption data and system events are analyzed in depth to highlight their impact on production stability and energy management.
3.1. Consumption Analysis and Event Processing in June
1) Consumption
The following graph shows consumption based on battery charge, inverter voltage, and generator power.
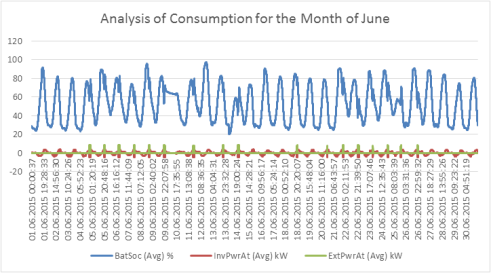
Figure 3. Battery State of Charge Curve, Inverter Voltage (kW), and Generator Power (kW) (June).
The analysis of consumption for the month of June consists of representing the battery's state of charge at any given moment. Measurements are taken every minute without interruption, ensuring that the data is highly accurate. The active power of the inverter is associated with this state of charge, showing the moments of charging and discharging. As the system has a generator to compensate for battery discharges, it is necessary to represent its operation in order to assess its relevance and, above all, its use.
The curves shown indicate a fairly unstable evolution of the parameters selected. From one day to the next, battery charging and discharging varies randomly. In fact, charging via photovoltaic panels varies between 94% and 73%, and charging via the generator varies between 68% and 80%, depending on the state of the batteries at the start of charging. As for discharges, depending on how the generator is operating, they can continue down to around 20%.
We also note an irregularity in the operation of the generator, which was only used 17 times in the 30 days of the month, despite critical drops in the battery charge level.
The change in consumption during the month of June can be assessed through the discharge of the batteries, based on the recording of the AhCntOut parameter (battery discharge meter in Ah), as the power plant only supplies energy to consumers via the batteries.
The following curve shows this.
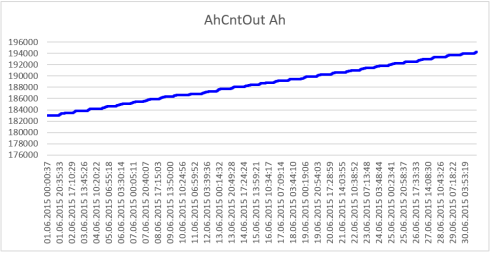
Figure 4. AhCntOut (Ah) Curve (Battery Discharge) – June.
To get an idea of the plant's operating hours in terms of desertion, it is useful to show the consumption recorded on June 1.
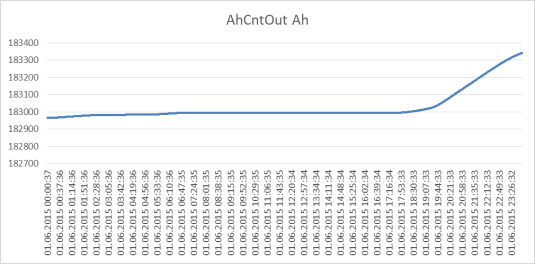
Figure 5. Consumption on June 1.
This evolution highlights a service to the population mainly between 6 p.m. and 2 a.m., and then between 5 a.m. and 7 a.m. It clearly shows that the daytime is essentially dedicated to charging the batteries, which supply power to consumers during the night.
For the month of June, the meter increased from 182,964 Ah to 194,277 Ah, representing a total consumption of 11,313 Ah.
2) Battery health (Soh: state of health)
The following graph shows battery heating based on charge status.
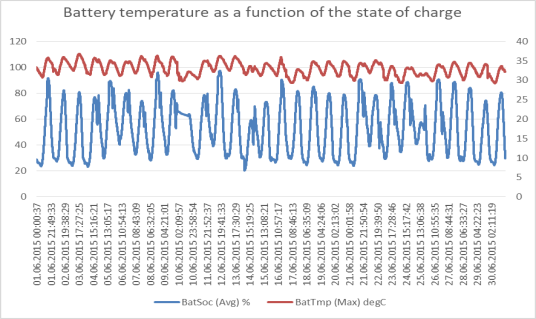
Figure 6. Battery Temperature vs. State of Charge.
There is an increase in battery temperature depending on the charge, and this change is almost linear. The higher the charge, the higher the temperature.
3) Heatsink temperature evolution as a function of the state of charge
As with batteries, the following graph shows the heating of the inverter depending on the state of charge.
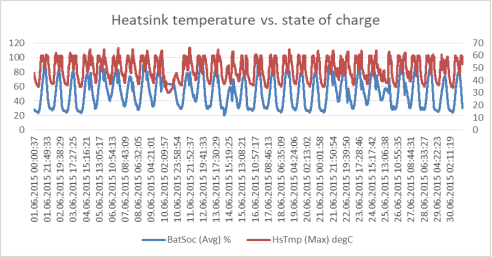
Figure 7. Heatsink Temperature vs. State of Charge.
The temperature of the heat sink also increases depending on the state of charge of the batteries.
4) Event handling
The following table shows all events that occurred during the month of June.
Table 1. Summary of Recorded Events – June.

Event Code

Category

Description

Count

E101

Status

Standby state

43

E102

Status

Device startup

43

E103

Status

Device in operation

43

E104

Status

Operating with generator

16

E110

Error

Shutdown due to error

43

E118

Action/Status

Automatic startup

42

E119

Action/User

Manual startup

1

E207

Battery/Charging

Switch to battery equalization charge mode

1

E401

Generator Control

Automatic generator start (e.g., based on SOC)

1491

E601

Relay Status

Multifunction relay 1 is at rest

1492

E602

Relay Status

Multifunction relay 1 is energized

1491

E609

Relay Status

Internal transfer relay open

16

E610

Relay Status

Internal transfer relay closed

16

E617

Relay Status

Multifunction relay 2 is at rest

64

As shown in Table 1, in total, seventeen (17) different types of events were recorded during the month of June. Among them, forty-three (43) startups (E102) corresponded to an equal number of standby states (E101) and operation states (E103). Indeed, following each shutdown due to error (E110), a restart — either automatic (42 cases of E118) or manual (1 case of E119) — was required. Out of the 1,491 generator start requests triggered by a critical battery charge level (E401), only 16 resulted in an actual startup (E104). This startup is confirmed by the closing of the internal transfer relay (E610), which reopens during shutdown (E609).
5) Analysis of shutdowns
Two different error levels were noted:
a) Warnings: the system continues to operate. Their codes begin with a W.
b) Failures: the inverter shuts down, requiring the error to be eliminated, acknowledged, and then manually restarted. These events are coded with the letter F.
Below is a table showing the shutdowns recorded during the month of June.
Table 2. Details of Suspensions and Warnings – June.

Event

Meaning

Occurrence

F117

F117 – AC phase L1 current limitation: consumer load is too high for the master

44

F710

F710 – Autostart counter expired in the device on L1 (multiple successive auto-starts)

13

W212

W212 – Battery over-temperature error: the battery temperature is too high

1

W331

W331 – External grid disconnection due to unintended islanding on phase L1: unintended islanding occurs on the master’s AC2 connection

14

W343

W343 – External grid disconnection due to too low battery voltage or overvoltage on phase L1: the master disconnects from the external energy source because the AC2 connection voltage is too high or the battery voltage too low

1

W738

W738 – Synchronization with the generator failed

18

Source: Research Data – Badiari PV Plant
When a failure or error is detected, the system attempts an automatic restart (E 118). If the error persists, the system sends a new notification. This is why, for two (2) F117 events during the month of June, 44 notifications were recorded. The error notification only disappears once the error has been corrected. Excessive battery temperature was detected once, on June 11 at 10:18 p.m. An external power outage occurred only once, on June 20 at 9:07 p.m. The battery voltage, measured every minute, was 49.9 V. We can therefore conclude that this outage was due to a power surge on phase L1.
6) Calculation of reliability times
We were able to determine two average reliability times:
– MTBF: Mean Time Between Failure,
– MTTR: Mean Time To Repair.
Table 3 summarizes the reliability indicators calculated for the Badiari mini-grid, including the Mean Time Between Failures (MTBF) and the Mean Time To Repair (MTTR).
Table 3. MTBF and MTTR Calculations.

Date

Start Time

Finish Time

Downtime (min)

Notes

06-June

08:58:27 AM

08:58:16 AM

0.18

F117 – AC phase L1 current limitation: consumer load too high for the master

06-June

05:25:18 PM

05:25:29 PM

0.18

F117 – AC phase L1 current limitation: consumer load too high for the master

10-June

12:24:01 AM

02:21:07 AM

117.10

F117 – AC phase L1 current limitation: consumer load too high for the master

11-June

11:34:56 AM

12:27:54 PM

52.97

F117 – AC phase L1 current limitation: consumer load too high for the master

Source: Research Data – Badiari PV Plant
During the month of June, the Badiari hybrid photovoltaic installation exhibited an operational availability of 43,800 minutes. Over this period, a total of four (4) critical failure events were recorded, corresponding to complete inverter shutdowns requiring system restart. Based on these observations, the Mean Time Between Failures (MTBF) was calculated at 10,907 minutes, indicating the average duration of normal operation between two successive failures. In addition, the Mean Time To Repair (MTTR) was estimated at 43 minutes, reflecting the average time required to restore system operation following a failure.
Four (4) failures were recorded during the month of June. These failures were mainly due to excessive consumer power demand. During these periods, the demand exceeded the system’s production capacity, causing the inverter to shut down in order to protect the installation.
With a total downtime rounded to 170 minutes, a failure (MTBF: Mean Time Between Failure) occurs every 10,907 minutes, with an average repair time (MTTR: Mean Time To Repair) of 43 minutes.
3.2. Synthesis of Study Results: June, July, and August
1) Consumption and Battery Health
Table 4 presents the monthly evolution of energy consumption and the corresponding variation in the State of Health (SOH) of the battery bank between June and August. The SOH indicator was estimated based on cumulative charge–discharge cycles extracted from inverter logs.
Table 4. Consumption and Battery Health.

Month

Total Consumption (Ah)

Average Daily Consumption (Ah)

Initial SOH (%)

Final SOH (%)

SOH Variation (%)

June

11 313

~377

68.0

58.9

-9.1

July

10 602

~353

58.9

56.7

-2.2

August

8 019

~320

56.7

56.7

0

Source: Research Data – Badiari PV Plant
The total energy consumption decreased gradually from 11 313 Ah in June to 8 019 Ah in August, mainly due to seasonal variations and reduced community demand during the rainy period. At the same time, the , indicating significant degradation linked to high ambient temperatures and deep discharge cycles .
In contrast, July and August show a stabilization of SOH (−2.2% and 0%), suggesting improved charge control and fewer critical discharge events.
Repeated deep discharge cycles are known to accelerate capacity fade and reduce the state of health of lead-acid batteries, as demonstrated in model-based SOH estimation studies .
2) Generator Usage
Table 5 summarizes the monthly operation of the backup generator for the Badiari PV hybrid system during the monitoring period from June to August. The analysis compares the number of automatic start requests (E401) triggered by the inverter with the effective starts (E104) successfully executed.
Table 5. Generator Usage.

Month

Start Requests (E401)

Effective Starts (E104)

Success Rate (%)

June

1 491

16

1.1

July

1 594

12

0.8

August

1 292

14

1.1

Source: Research Data – Badiari PV Plant
The generator was requested to start over 1 200 times per month, but only a few start commands were successfully executed. The success rate remained extremely low, ranging from 0.8% in July to 1.1% in June and August.
The highest number of start requests occurred in July (1 594), coinciding with a decline in solar irradiation and battery autonomy during the peak of the rainy season. However, this month also recorded the lowest start success rate, suggesting recurring technical issues in the automatic ignition circuit or the fuel supply system.
3) Recorded Events
Table 6 summarizes the main types of operational events recorded by the inverter and monitoring system from June to August 2024. These events include automatic generator start requests (E401), communication events (E601/E602), equalization charges (E207), and shutdowns (E110), among others. The table highlights the frequency and diversity of system alerts and actions logged during each month.
Table 6. Recorded Events.

Month

Total Events

Main Events

Observations

June

17 types – >4,000 occurrences

E401 (1491), E601/E602 (1492/1491)

Large gap between generator requests and actual starts

July

10 types – >4,000 occurrences

E401 (1594), E601/E602 (1594/1594)

Only one shutdown (F201), 9 islanding cases (W331)

August

15 types – >3,000 occurrences

E401 (1292), E601/E602 (1292/1301)

New: 15 equalization charges (E207), 14 shutdowns (E110)

Source: Research Data – Badiari PV Plant
The system recorded a large number of events each month, exceeding 4,000 log entries in both June and July, and more than 3,000 in August.
In June, the most frequent events were E401 (1,491 start requests) and E601/E602 (1,492/1,491 communication logs), illustrating a significant mismatch between generator start commands and effective activation. This confirms the mechanical or electrical issues identified earlier in the generator’s ignition system.
In July, the number of start requests increased to 1,594, and the generator communication codes perfectly matched (E601/E602 = 1,594/1,594), suggesting improved signal reliability. However, this month still recorded one inverter shutdown (F201) and nine islanding events (W331), revealing intermittent grid instability.
In August, despite a lower total number of events (≈3,000), new types of operations appeared, such as equalization charges (E207) and multiple shutdowns (E110), likely due to high temperatures and charge balancing operations within the battery management cycle.
4) Shutdowns and Warnings
Table 7 summarizes the main shutdowns and warning codes recorded by the SMA inverter from June to August. Each error or warning code (Fxxx or Wxxx) corresponds to a specific malfunction detected by the inverter’s diagnostic system, including voltage deviations, synchronization faults, and thermal protection events.
Table 7. Shutdowns and Warnings.

Month

Main Codes

Occurrences

Main Causes

June

F117 (44), F710 (13), W738 (18)

≈ 75

AC current limitation, generator sync failure, overvoltage

July

F201 (1), W331 (9), W738 (12)

≈ 22

Islanding, overvoltage, synchronization failure

August

F109 (14), F113 (5), F121 (5), F201 (1), W137 (7), W331 (12), W738 (12)

≈ 56

High temperatures, overvoltages, battery voltage out of range

Source: Research Data – Badiari PV Plant
The month of June exhibited the highest number of events (≈ 75), dominated by codes F117, F710, and W738, mainly associated with AC current limitation, generator synchronization failure, and overvoltage. These faults are characteristic of high ambient temperature and load imbalance conditions.
In July, the number of occurrences dropped sharply to ≈ 22, with faults such as F201 and warnings W331 and W738, corresponding to islanding conditions and voltage instability.
In August, the system again experienced a rise in failures (≈ 56 occurrences), including multiple high-temperature and overvoltage events (F109, F113, F121, W331, W738). These were primarily linked to battery voltage fluctuations and cooling inefficiencies during sustained high temperatures.
5) Reliability (MTBF and MTTR)
Table 8 presents the reliability indicators calculated for the Badiari photovoltaic installation between June and August. The parameters include total system availability, number of failure events, total downtime, and the derived values of Mean Time Between Failures (MTBF) and Mean Time To Repair (MTTR) .
Table 8. Reliability (MTBF and MTTR).

Month

Availability (min)

Failures

Total Downtime (min)

MTBF (min)

MTTR (min)

June

43,800

4

170

10,907

43

July

44,640 (31 d)

1

~60

-

-

August

36,000

4

1,315

8,671

329

Source: Research Data – Badiari PV Plant
6) Global Summary (June–August)
Table 8 provides a global summary of the main operational indicators of the Badiari photovoltaic installation over the three-month monitoring period from June to August 2024. The metrics include total energy consumption, the evolution of battery State of Health (SOH), generator activity, and cumulative system downtime.
Table 9. Global Summary (June–August).

Key Indicator

June

July

August

Total / Trend

Total Consumption (Ah)

11,313

10,602

8,019

29,934 Ah

Battery SOH (%)

68 58.9

58.9 56.7

Stable 56.7

-11.3 pts over 3 months

Effective Generator Starts

16

12

14

42 starts

Shutdowns (critical failures)

4

1

4

9 total

Total Downtime (min)

170

~60

1,315

~1,545 min

Source: Research Data – Badiari PV Plant
4. Discussions and Recommendations
4.1. Discussions
The consumption analysis reveals several points that are worth considering:
Consumption is exclusively through the batteries. We remind you that the system charges the batteries during the day and in the evening, supplying energy to consumers. The striking observation is that, under normal operating conditions, the batteries are deeply discharged every evening. While the system was designed for a 40% discharge, most of the time it falls below the 30% mark, and we have even noted discharges causing the batteries to fall below 21%. We also note that, over the three months, the system never managed to fully recharge the storage.
The operational challenges observed in the Badiari mini-grid are consistent with trends reported at the global level, where off-grid and mini-grid photovoltaic systems continue to face reliability and maintenance issues despite their rapid deployment worldwide .
One of the reasons for this excessive use of the batteries is that the generator, whose main role is to recharge the system when the level falls below 40%, only operated 16 times in June, 12 times in July, and 14 times in August. Even when in operation, the unit does not run for more than 40 minutes, which is just enough to increase the charge by 10%. During the same night, the batteries drop below 30% as consumption continues .
As the study was conducted during the winter period, when it rains most of the time in the region, it is clear that the system does not have sufficient autonomy. A 1000 Ah bench is available. This is considered to be quite small given the consumption, which is never satisfied. The average daily consumption for June, July, and August is 377, 353, and 320 Ah respectively, with a daily supply of 6 hours.
Batteries discharged by 25% would give 2,200 cycles, while those discharged by 75% would give 550 cycles. Therefore, at the plant's operating rate, the batteries would last four times less than expected. This will extend their expected amortization period to seven (7) years. The study noted a deterioration in the health of the batteries. Over the three months, due to repeated deep discharges, we went from 68% to 56.7% health.
System failures are mostly related to power surges. This is often due to demand exceeding supply, either because users are connecting more devices than expected or because of an increase in the number of households connected to the grid. In addition to power surges, islanding, which is caused by broken wires in the grid, has also been observed .
In August in particular, overheating problems occurred. These high temperatures caused the system to shut down on several occasions, due to critical thresholds being exceeded, both at the inverter (heat sink) and battery levels.
4.2. Recommendations
This study was conducted at a solar power plant with a 5.1 kWp photovoltaic field. The months of June, July, and August were chosen because during these months the region experiences heavy rainfall that can last for several days. This allowed us to test the system's autonomy and its resistance to extreme humidity and temperature conditions. This period is one of the hottest that the area can experience. From the point of view of the panels, cleaning is carried out almost daily.
Given that the battery bank is 1000 Ah, it can be said that the system is oversized. An in-depth analysis of consumption reveals that this same battery bank is undersized in terms of consumption. This leads to deep discharges, which have disastrous consequences for the health and lifespan of the batteries. The average consumption over the three months is 350 Ah per day. To remain below 95% charge and above the recommended 50%, these 1,000 hours may be sufficient. But that's without taking into account the fact that it can rain all day long in the area for two days. During the study, this phenomenon occurred on August 14 and 15. In the middle of the rainy season, it is difficult to fully charge the batteries due to the frequent rain (up to 20 days of rain in August).
An increase in battery capacity is necessary. A 2500 Ah battery bank could prevent the batteries from discharging to less than 50%, meaning that the generator would only be used in the event of a failure or when the storage capacity falls below 40% in the event of repeated rain that would prevent charging via solar panels. This would significantly increase the life of the batteries because, as we have seen, discharging them to less than 30% reduces their life by more than two-thirds. It could also reduce breakdowns due to low battery capacity, which totaled 1,125 minutes in August alone.
In August in particular, with high temperatures, the system experienced several failures. Temperature increases were the cause of 75 minutes of downtime out of the 1,315 recorded. Therefore, a well-ventilated technical room with a ventilation system, if necessary, would reduce breakdowns by 5%.
In June, 170 minutes of downtime were recorded due to excessive power consumption. As it is not possible to control the equipment used by consumers, it is recommended that power limiters be installed. This technical device, placed on the electricity meter, restricts the power available to a household, preventing the simultaneous use of several electrical appliances. Such a system would have reduced the duration of outages from 170.36 minutes to just 0.36 minutes, a decrease of more than 99%.
In addition to the operational issues identified, a data driven predictive maintenance framework could be implemented to prevent recurring failures. Integrating IoT sensors for continuous tracking of inverter temperature, voltage, and battery state of charge (SOC) would allow early detection of anomalies and trigger preventive maintenance alerts. Coupling these data streams with the existing Computerized Maintenance Management System (CMMS) would shift the current maintenance approach from reactive to predictive, significantly improving system uptime and reliability in rural mini grids.
5. Conclusion
Senegal has invested heavily in renewable energy, with several hundred billion dollars allocated to the sector, of which solar energy represents a significant share. However, among the more than 500 small power plants deployed nationwide, many are currently malfunctioning, and some are no longer operational. This situation highlights the critical importance of real-time monitoring for accurate assessment of photovoltaic system performance .
The analysis of an off-grid solar power plant located in southern Senegal, a region characterized by high rainfall, provided valuable insights for improving both the design and maintenance of rural photovoltaic installations. The study was based on the collection of operational data over a three-month period (June, July, and August), including all recorded system events such as shutdowns and warnings. In total, 123,165 production records and 14,121 event logs were analyzed, enabling a detailed understanding of energy flows and consumption patterns.
The results revealed a significant mismatch between stored energy and consumer demand. Based on this observation, several recommendations were formulated, including increasing battery bank capacity to extend battery lifetime and reduce reliance on the backup generator, thereby improving supply regularity.
Event analysis further showed that excessive consumer power demand is a recurrent cause of system outages, justifying the implementation of power limiters at the user level. In addition, islanding events were frequently observed, indicating the need for regular network inspections and continuity testing. Several failures related to excessive temperatures were also identified, supporting the recommendation to improve ventilation in the technical room and, where possible, install dedicated cooling systems during the hottest periods.
As Senegal aims to increase the share of renewable energy to 40% of national electricity production, the maintenance of solar installations must be treated as a strategic priority. Without adequate monitoring and maintenance frameworks, these systems risk reaching the same advanced state of deterioration observed in existing solar infrastructures, ranging from public lighting to power plants .
Building on these findings, future efforts will focus on the implementation of predictive maintenance approaches that integrate real-time data acquisition, failure prediction, and optimized intervention planning. Such approaches represent a key lever for safeguarding long-term investments in solar energy and enhancing the reliability of renewable power supply in both rural and urban contexts.
Abbreviations

Ah

Ampere-Hour

AC

Alternating Current

BatSOC

Battery State of Charge

BatSOH

Battery State of Health

CMMS

Computerized Maintenance Management System

DC

Direct Current

E101

Standby State (SMA Event Code)

E102

Device Startup (SMA Event Code)

E103

Device in Operation (SMA Event Code)

E104

Operating with Generator (SMA Event Code)

E110

Shutdown Due to Error (SMA Event Code)

E118

Automatic Restart (SMA Event Code)

E119

Manual Restart (SMA Event Code)

E207

Battery Equalization Charge Mode (SMA Event Code)

E401

Automatic Generator Start Request (SMA Event Code)

E601

Multifunction Relay 1 at Rest (SMA Event Code)

E602

Multifunction Relay 1 Energized (SMA Event Code)

E609

Internal Transfer Relay Open (SMA Event Code)

E610

Internal Transfer Relay Closed (SMA Event Code)

E617

Multifunction Relay 2 at Rest (SMA Event Code)

Fxxx

Failure Event Code (Inverter Shutdown)

FMEC

Failure Modes, Effects, and Criticality

IEC

International Electrotechnical Commission

InvPwrAt

Inverter Active Power

IRENA

International Renewable Energy Agency

JETP

Just Energy Transition Partnership

kVA

Kilovolt-Ampere

kWp

Kilowatt-Peak

MTBF

Mean Time Between Failures

MTTR

Mean Time to Repair

PV

Photovoltaic

SOC

State of Charge

SOH

State of Health

SNASE

National Strategy for Sustainable Energy Access

Wxxx

Warning Event Code (Non-blocking Event)

Conflicts of Interest
The authors declare no conflicts of interest.
References
[1] ANER. (2022) Annual report on energy access and solar projects in Senegal. National Agency for Renewable Energy.
[2] Heinrich Böll Stiftung Senegal. (2025) Accelerating the energy transition in Senegal: regulatory framework and governance. Heinrich Böll Stiftung Senegal, Dakar.
[3] GIZ. (2023) Decentralized rural electrification in Senegal. Deutsche Gesellschaft für Internationale Zusammenarbeit (GIZ). Available at:
[4] Proparco. (2016) Bokhol, the first large-scale solar power plant in French-speaking West Africa. Available at:
[5] Lekela Power. (2020) Taïba Ndiaye wind farm project. Available at:
[6] Team France Export. (2023) Market Sheet – Energy transition in Senegal. Available at:
[7] UNDP. (2021) Mini-grids for rural electrification in West Africa: Case of Senegal. United Nations Development Programme.
[8] SMA Solar Technology AG. (2020) Sunny Island 6.0H / 8.0H - Technical Information. Available at:
[9] SMA Solar Technology AG. (2015) Operating Manual - SUNNY ISLAND 6.0H / 8.0H. Available at:
[10] REN21. (2024) Renewables Global Status Report 2024. REN21 Secretariat. Available at:
[11] IRENA. (2016) Innovation Outlook: Renewable Mini-Grids. International Renewable Energy Agency (IRENA). Available at:
[12] SEforALL & ESMAP. (2020) State of the Global Mini-Grids Market Report 2020. Sustainable Energy for All (SEforALL). Available at:
[13] Abdulla, H. (2024) Photovoltaic systems operation and maintenance: A review. Renewable and Sustainable Energy Reviews. (review article summarizing O&M best practice).
[14] Marangis, D. (2025) Intelligent maintenance approaches for improving PV plant uptime. Solar R&D (review).
[15] Hamza, A. (2025) A multi-stage review framework for AI-driven predictive maintenance of PV systems. Applied Energy (review).
[16] Mohsin, M. (2022) A new lead-acid battery state-of-health evaluation method using electrochemical impedance spectroscopy for second life in rural electrification systems. Journal of Energy Storage.
[17] Sadabadi, K. K. (2021) Model-based state of health estimation of a lead-acid battery using equivalent circuit models. Journal of Energy Storage.
[18] Huang, C. (2023) Fast health state estimation of lead–acid batteries based on charging curve analysis. Electronics.
[19] Alobaid, M. (2023) A comprehensive review and assessment of islanding detection methods for PV systems. Renewable Energy Communications.
[20] Zini, G. (2011) Reliability of large-scale grid-connected photovoltaic systems. Renewable Energy.
[21] Pimpalkar, R. (2025) Reliability analysis and life cycle costing of rooftop solar PV: methods and case studies. Sustainable Energy Tech & Economics Today.
[22] Babayomi, O. O. (2023) Review of renewable off-grid mini-grids in Sub-Saharan Africa. Frontiers in Energy Research.
[23] Guillou, E. (2023) Mini-grids at the interface: deployment and territorial approaches — fieldwork in Senegal, Tanzania and India. Energy Policy Journal.
[24] Etienne, E. (2024) Can isolated microgrids be viable? A longitudinal study of a Senegalese village microgrid. Energy for Sustainable Development.
[25] Petrusevich, M. (2024) Assessing the impacts of solar mini-grids on energy access and socioeconomic outcomes. Development Economics Review.
[26] Obatola, S. O. (2024) Reliability overview of grid-connected solar PV systems. Applied Automation & Energy Systems Journal.
[27] Roy, A. (2022) The effect of fast charging and equalization on the reliability and cycle life of lead-acid batteries. Journal of Energy Storage.
[28] Belmokhtar, K. (2016) Charge equalization systems for serial valve regulated batteries. International Conference Proceedings on Energy Storage Systems.
[29] Battery University. (2011) BU-404: What is Equalizing Charge? (practical technical note on VRLA/flooded lead-acid equalisation). Available at:
[30] Catherino, H. A. (2004) Sulfation in lead–acid batteries. Journal of Power Sources.
[31] Juanico, D. E. O. (2024) Revitalizing lead-acid battery technology: desulfation and charging techniques. Frontiers in Batteries and Electrochemistry.
[32] IEEE PVTC / IEEE Transactions on Sustainable Energy (selected articles) — e.g., studies on inverter reliability and failure modes.
[33] International Electrotechnical Commission (IEC). (2014) IEC 62116: Test procedure of islanding prevention measures for inverter-based distributed generation systems.
[34] World Bank. (2021) Mini-grids: A Case for Smart Policy and Financing. World Bank Report on Off-grid Electrification.
[35] IEA. (2022) Electricity Access and Mini-Grids: Policies for sustainability. International Energy Agency report.
[36] REN21 / IEA collaborative papers on mini-grid regulation and grid integration (policy briefs).
[37] Research article: “Mean Time Between Failure (MTBF) Calculation of Solar PV Systems” (technical note / conference paper) — methodology for MTBF/MTTR calculation in PV plants.
[38] ResearchGate/Academic review: “Machine Learning for Predictive Maintenance in Solar Farms” (2025) — ML algorithms for fault prediction.
[39] Minigrids.org. (2024) State of the Market Report 2024 — State of the Global Mini-Grids Market. Available at:
[40] EEPowerSolutions / technical white paper. (Year) The proper charging of stationary lead-acid batteries: float, equalize and temperature compensation (industry white paper).
Cite This Article
  • APA Style

    Sarr, O. N., Fall, M. F. M., Seck, E. H. B., Thiam, M. (2026). Reliability Analysis and Performance Assessment of the Badiari Hybrid Photovoltaic Power System (Sedhiou, Senegal). International Journal of Sustainable and Green Energy, 15(1), 1-13. https://doi.org/10.11648/j.ijsge.20261501.11

    Copy | Download

    ACS Style

    Sarr, O. N.; Fall, M. F. M.; Seck, E. H. B.; Thiam, M. Reliability Analysis and Performance Assessment of the Badiari Hybrid Photovoltaic Power System (Sedhiou, Senegal). Int. J. Sustain. Green Energy 2026, 15(1), 1-13. doi: 10.11648/j.ijsge.20261501.11

    Copy | Download

    AMA Style

    Sarr ON, Fall MFM, Seck EHB, Thiam M. Reliability Analysis and Performance Assessment of the Badiari Hybrid Photovoltaic Power System (Sedhiou, Senegal). Int J Sustain Green Energy. 2026;15(1):1-13. doi: 10.11648/j.ijsge.20261501.11

    Copy | Download

  • @article{10.11648/j.ijsge.20261501.11,
      author = {Omar Ngala Sarr and Mame Faty Mbaye Fall and El Hadji Boubacar Seck and Mouhamadou Thiam},
      title = {Reliability Analysis and Performance Assessment of the Badiari Hybrid Photovoltaic Power System (Sedhiou, Senegal)},
      journal = {International Journal of Sustainable and Green Energy},
      volume = {15},
      number = {1},
      pages = {1-13},
      doi = {10.11648/j.ijsge.20261501.11},
      url = {https://doi.org/10.11648/j.ijsge.20261501.11},
      eprint = {https://article.sciencepublishinggroup.com/pdf/10.11648.j.ijsge.20261501.11},
      abstract = {In the context of the energy transition and Senegal’s objective to increase the share of renewable energy to 20%, this study investigates the reliability of an off-grid photovoltaic (PV) power plant located in the village of Badiari, Sédhiou region, in the south of the country. Over a three-month period (June to August), corresponding to the rainy season, the 5 kWp production system was continuously monitored using an intelligent SMA inverter, enabling minute-by-minute data collection. The analysis reveals a clear mismatch between the system’s generation capacity and the users’ energy demand. The lead-acid batteries (1,000 Ah) undergo recurrent deep discharges, occasionally reaching critical levels (21 % state of charge), significantly shortening their operational lifespan. Simultaneously, the backup generator, intended to mitigate these deep discharges, is seldom activated. Frequent overvoltage events, shutdowns due to extreme temperatures (up to 80 °C at the heat sink), and islanding phenomena highlight both system imbalance and structural vulnerability. Reliability metrics were quantified, with a Mean Time Between Failures (MTBF) of 10,907 minutes and a Mean Time To Repair (MTTR) of 43 minutes in June, compared to 8,671 minutes and 329 minutes, respectively, in August. These values underscore the irregularity of energy supply. The findings emphasize the need to reconsider the sizing and maintenance strategies of rural solar installations. Recommended measures include increasing battery bank capacity (up to 2,500 Ah), introducing power limiters for consumers, and improving the thermal management of the technical room (ventilation, insulation). Implementing these strategies is expected to enhance local energy autonomy and improve the long-term sustainability of solar infrastructures.},
     year = {2026}
    }
    

    Copy | Download

  • TY  - JOUR
    T1  - Reliability Analysis and Performance Assessment of the Badiari Hybrid Photovoltaic Power System (Sedhiou, Senegal)
    AU  - Omar Ngala Sarr
    AU  - Mame Faty Mbaye Fall
    AU  - El Hadji Boubacar Seck
    AU  - Mouhamadou Thiam
    Y1  - 2026/01/16
    PY  - 2026
    N1  - https://doi.org/10.11648/j.ijsge.20261501.11
    DO  - 10.11648/j.ijsge.20261501.11
    T2  - International Journal of Sustainable and Green Energy
    JF  - International Journal of Sustainable and Green Energy
    JO  - International Journal of Sustainable and Green Energy
    SP  - 1
    EP  - 13
    PB  - Science Publishing Group
    SN  - 2575-1549
    UR  - https://doi.org/10.11648/j.ijsge.20261501.11
    AB  - In the context of the energy transition and Senegal’s objective to increase the share of renewable energy to 20%, this study investigates the reliability of an off-grid photovoltaic (PV) power plant located in the village of Badiari, Sédhiou region, in the south of the country. Over a three-month period (June to August), corresponding to the rainy season, the 5 kWp production system was continuously monitored using an intelligent SMA inverter, enabling minute-by-minute data collection. The analysis reveals a clear mismatch between the system’s generation capacity and the users’ energy demand. The lead-acid batteries (1,000 Ah) undergo recurrent deep discharges, occasionally reaching critical levels (21 % state of charge), significantly shortening their operational lifespan. Simultaneously, the backup generator, intended to mitigate these deep discharges, is seldom activated. Frequent overvoltage events, shutdowns due to extreme temperatures (up to 80 °C at the heat sink), and islanding phenomena highlight both system imbalance and structural vulnerability. Reliability metrics were quantified, with a Mean Time Between Failures (MTBF) of 10,907 minutes and a Mean Time To Repair (MTTR) of 43 minutes in June, compared to 8,671 minutes and 329 minutes, respectively, in August. These values underscore the irregularity of energy supply. The findings emphasize the need to reconsider the sizing and maintenance strategies of rural solar installations. Recommended measures include increasing battery bank capacity (up to 2,500 Ah), introducing power limiters for consumers, and improving the thermal management of the technical room (ventilation, insulation). Implementing these strategies is expected to enhance local energy autonomy and improve the long-term sustainability of solar infrastructures.
    VL  - 15
    IS  - 1
    ER  - 

    Copy | Download

Author Information